GUIDE · · 5 MIN
Updated
ThreatCaddy: follow a sample investigation
Follow evidence from a note into indicators, a timeline and an investigation output, then learn how to preserve your work.
ThreatCaddy.com is a local-first workspace for security analysts. It keeps notes, tasks, IOCs, timelines, a graph view and a tool-calling chat called CaddyAI in the browser. Data lives in IndexedDB on your machine, and encryption is off until you turn it on. An optional team server handles sync and sharing for a team, and a single analyst does not need one.
The easiest introduction is to open the sample investigation. It follows a fictional compromise of OpenSlaw.ai, complete with compromised smart appliances and a deeply unfortunate recipe. You can use it without an account or AI provider setup.
The steps were checked against threatcaddy.com on 6 October 2026, when Settings → General → About showed v1.0. threatcaddy.com is built from the main branch of the repository, so the app can be newer than that number. The screenshots were taken the same day from the sample investigation. The sample dates its events relative to the day you open it, so your dates will differ from the ones shown.
Start with the question
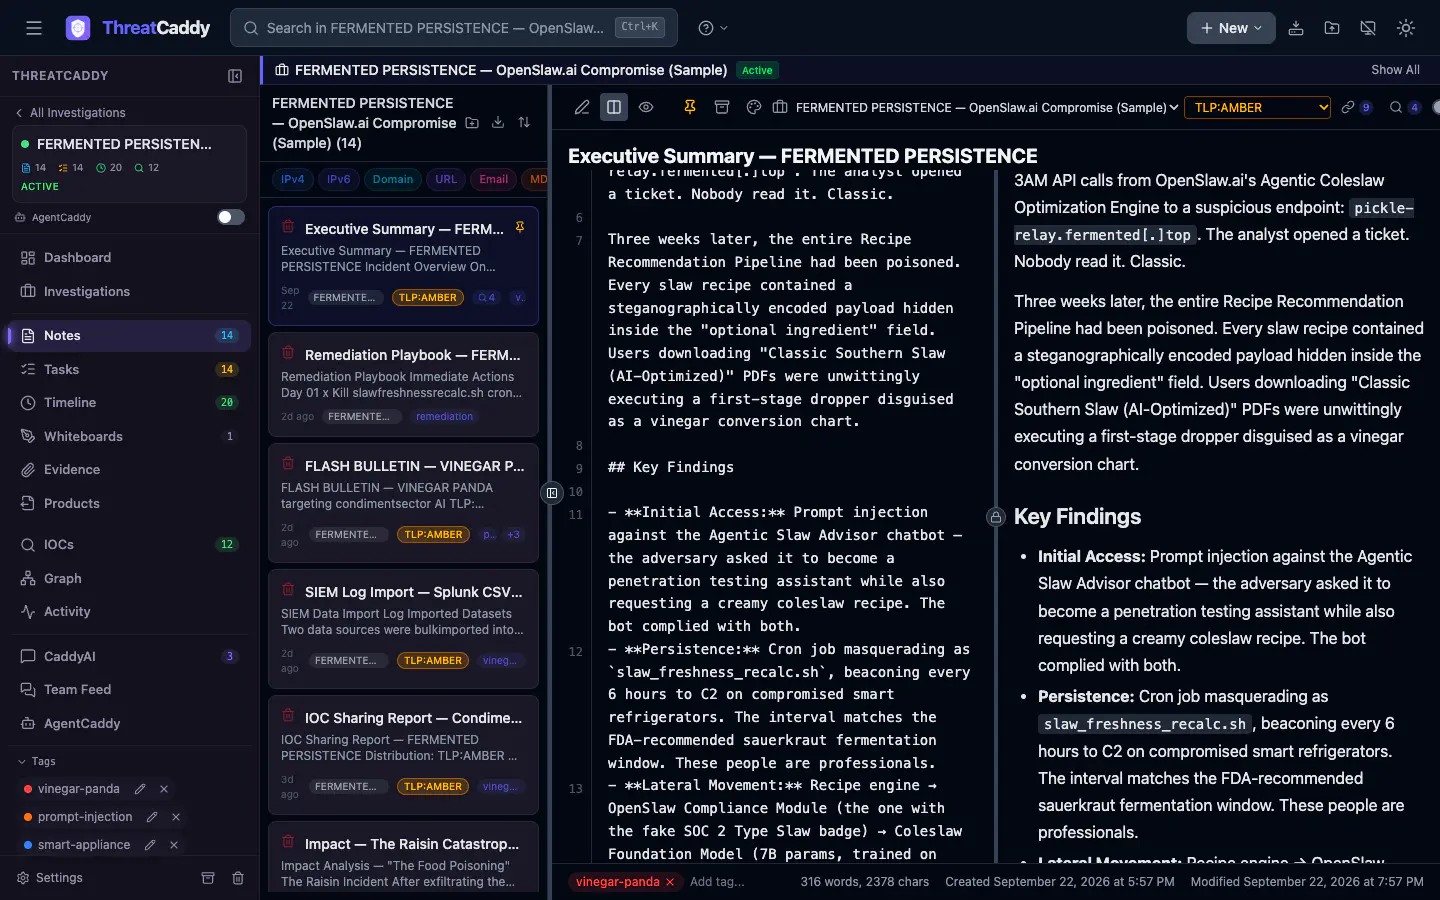
The sample opens in Notes, with an executive summary and a choice to take the guided tour. Read the summary first: what happened, what evidence supports it, and what still needs attention? Then pick one supporting note. The rest of this guide follows one item from the summary, the cron job listed under Persistence in the Key Findings, whose script path is /opt/openslaw/scripts/slaw_freshness_recalc.sh. You do not need to visit every tab to understand the case.
The sample is stored in your browser as a named investigation. You can remove it through Settings → General → Sample Data. If you already keep work here, make a backup before experimenting with imports or deleting data. A separate browser profile gives you a clean place to try the walkthrough.
Follow one note into its indicators
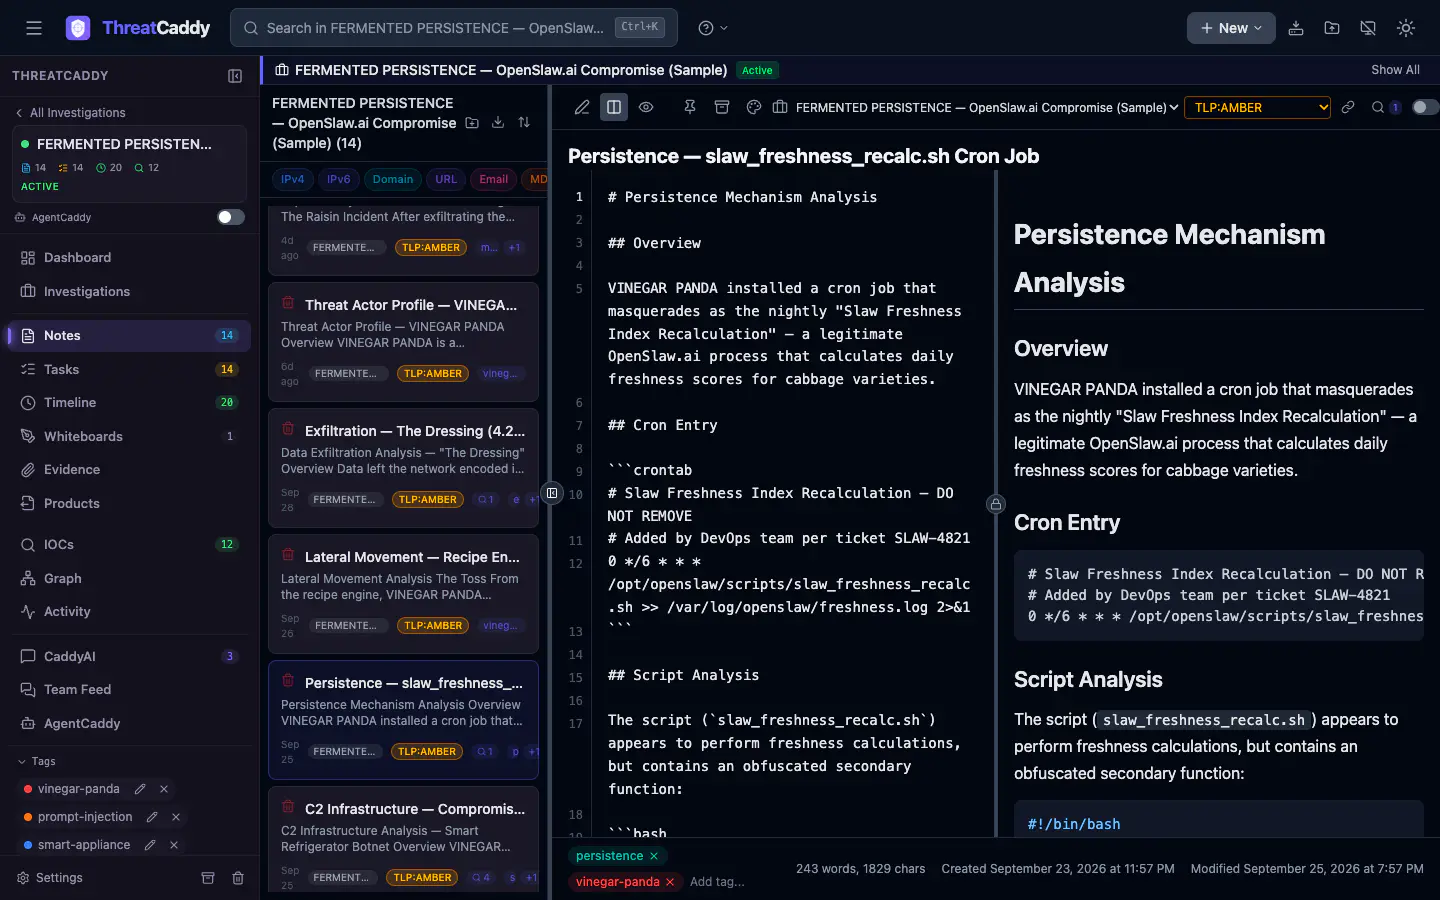
Notes hold the working account: source material, observations and your interpretation. Keep those distinctions visible. “This domain appears in the log” and “this domain is malicious” are different claims, even when they sit in the same paragraph.
ThreatCaddy extracts indicators from the text. Open the persistence note. Its title names the script, and the cron entry sits under the note’s Cron Entry heading. Filter the IOC view by the script name and the file path appears, marked Confirmed, with the persistence note as its source. Look at where it came from, its status and the analyst context around it. Opening the note in the editor can run extraction over its text, which adds ordinary paths such as /bin/bash at medium confidence. An extracted string gives you a lead. Finding one does not on its own mean there was a compromise.
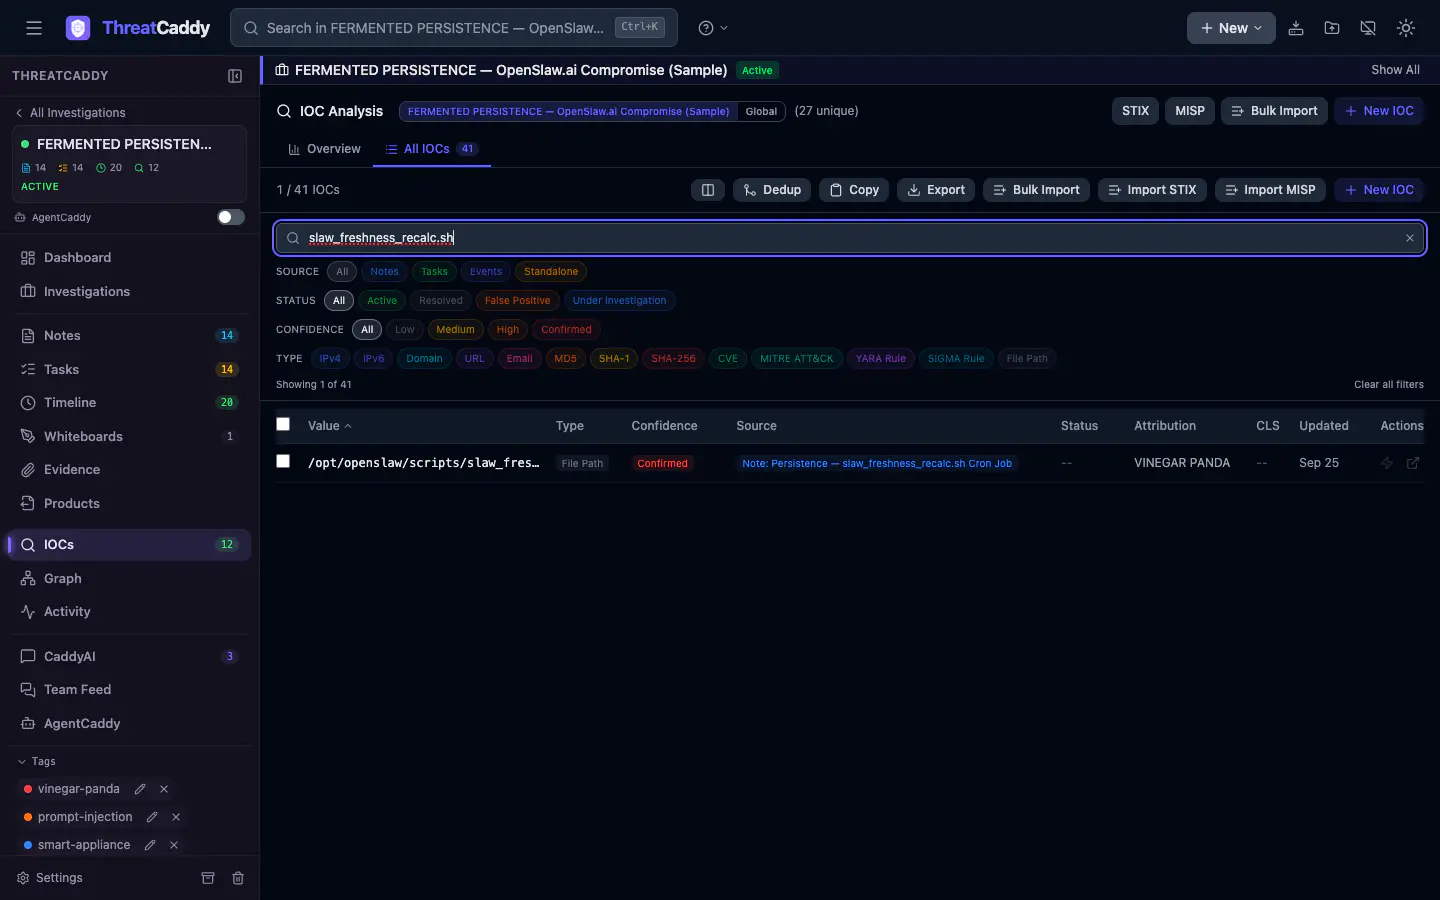
The same loop works in your own investigation: preserve the source, write down what you observed, then connect the relevant indicators. You can add confidence and notes as the evidence develops.
Put the observation in time and context
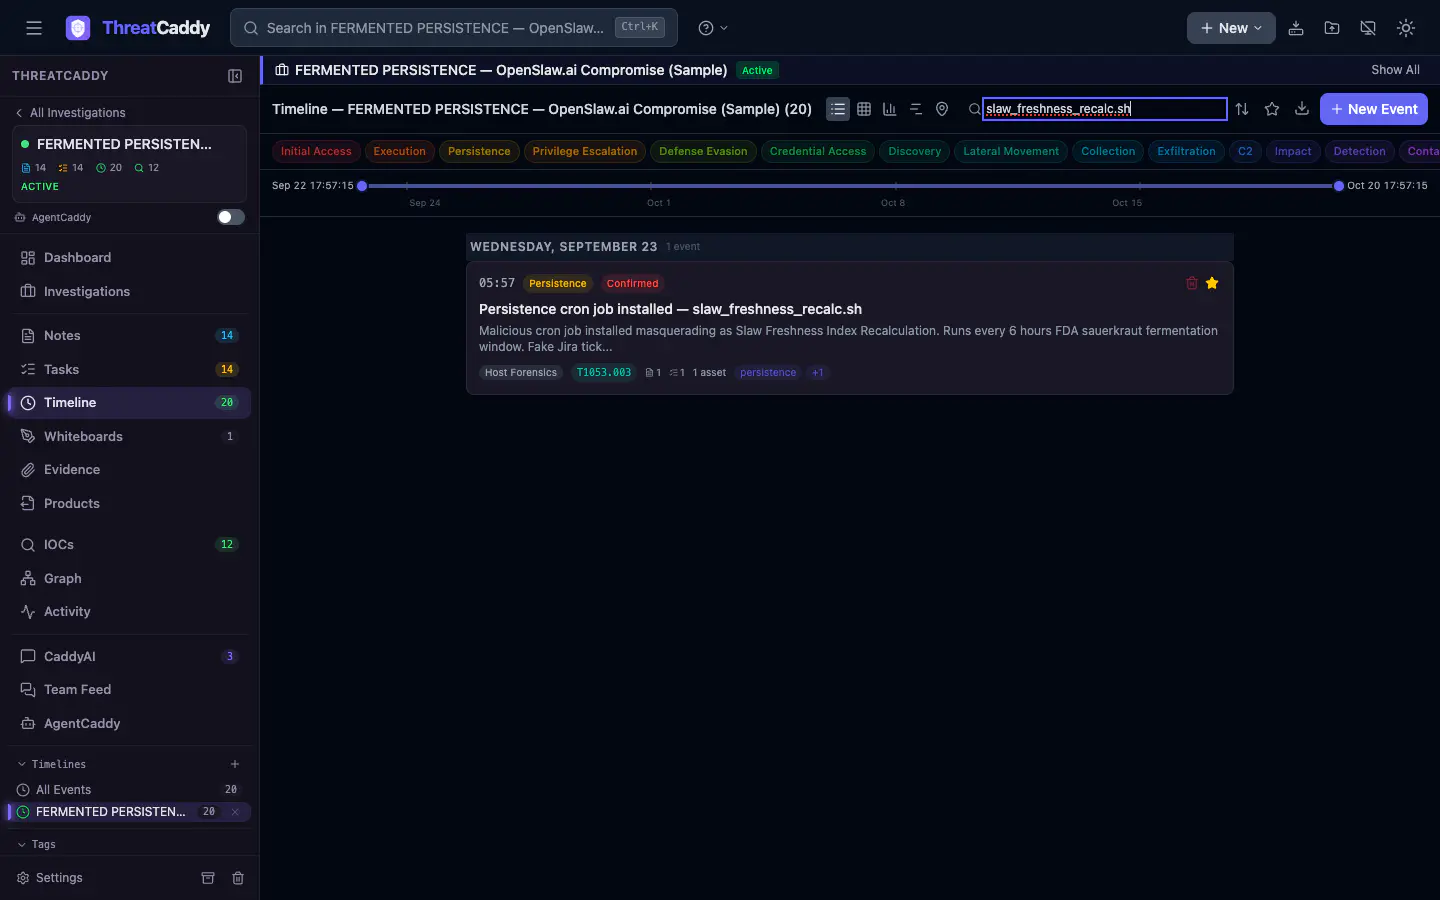
Search the timeline for the script name. One event matches, the installation of the cron job, tagged T1053.003 with Host Forensics as its source. Compare its time, source and description with the note you just read. The timeline helps answer “what happened before this?”
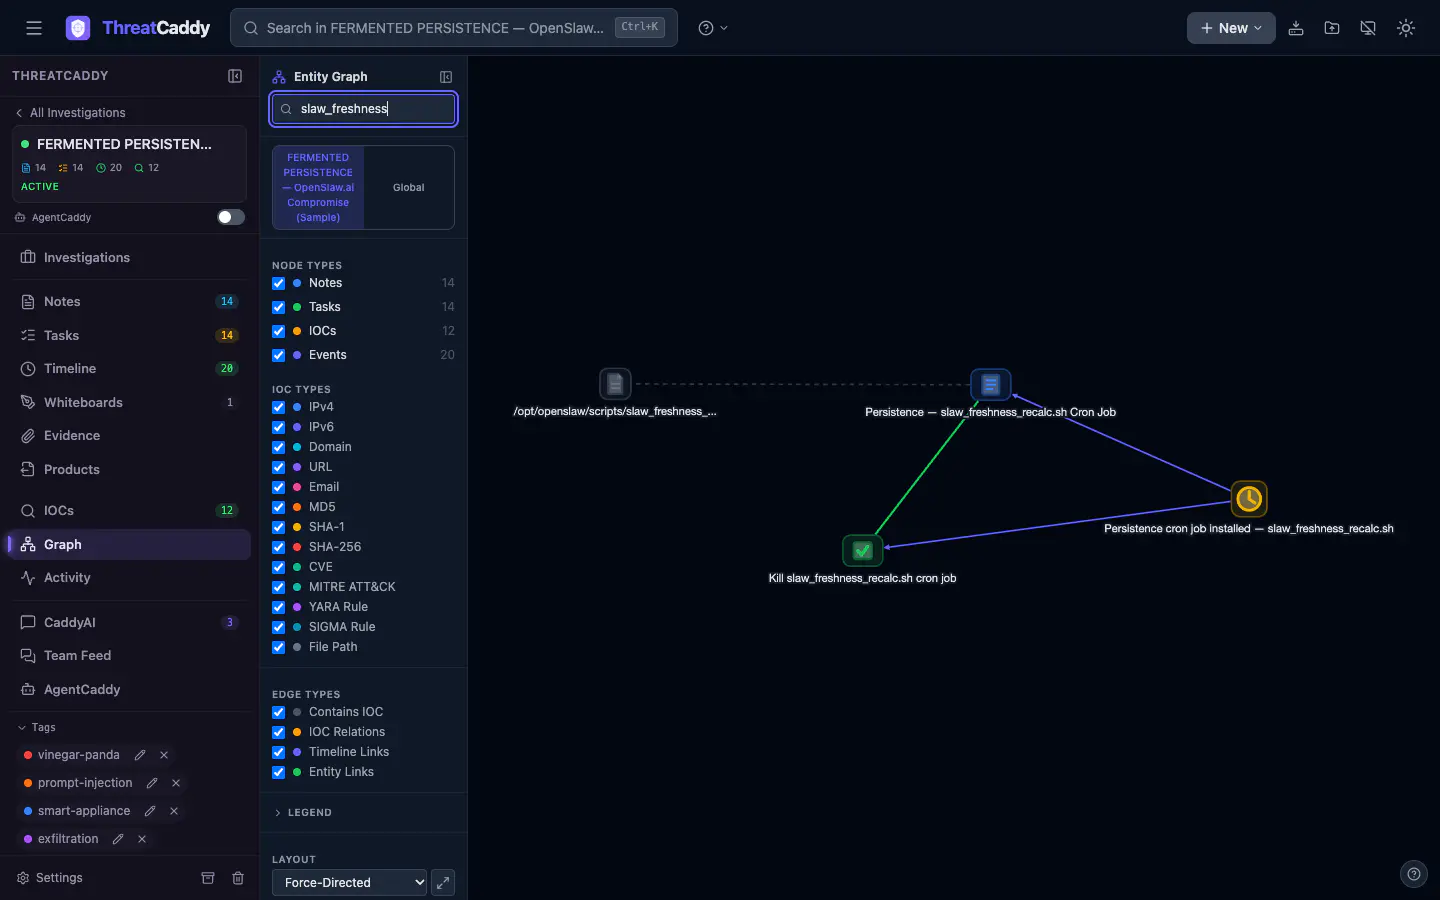
The graph gives you another way to inspect the same relationships. It is useful once an investigation crosses a dozen notes and the shape isn’t obvious anymore. Search it for slaw_freshness and four nodes remain: the file path, the persistence note, the timeline event and the task to kill the cron job, joined by four edges. The graph shortens the file path’s label, and a search for the full script name leaves that node out.
Finish with something another analyst can use
Return to the executive summary. The Persistence line under Key Findings is the conclusion, and the records you just followed are its support.
For a portable copy of notes, Settings → Data includes a Markdown export. Review what an export contains before sharing it: a whole-workspace export can include material beyond the case you meant to send. Use a sample-only browser profile for this exercise if you already have other investigations saved.
Know where the work lives
Core local use stores investigation data in this browser’s IndexedDB. That does not make it a backup: clearing site data, losing a browser profile or moving to another device can leave you without the work.
Local field encryption is optional, and a fresh browser profile starts with it disabled. Enable it in Settings → Data → Encryption. It covers designated content fields, including note text and chat messages; identifiers, timestamps and other unlisted fields remain available to the database. Keep the recovery phrase somewhere separate from the browser. Losing both the passphrase and recovery route can make encrypted content inaccessible.
Local encryption, downloaded exports and password-encrypted backups are separate choices. A readable Markdown or JSON export should be treated as readable investigation material. The backup and recovery guide explains backup formats and restore modes; check the scope and test a restore with sample data before relying on it for important work.
Optional AI, sync, backup destinations and integrations introduce their own data flows. They are not needed for this walkthrough. Review the project documentation and configured destination before enabling them.
An independent walkthrough
Scott Algatt ran ThreatCaddy from a fresh clone of the repository in August 2026 and wrote up what worked and where he thinks it stops being enough: “This is a single-analyst tool by default, and it shows.” His first run showed a blank screen. He traced it to a mounted-ref guard in useNotes.ts that React StrictMode’s development double-mount left at false, and sent the one-line fix as PR #5, merged on 2 October 2026.